How To Write an
IELTS Bar Chart Essay
There are 5 steps to writing a good IELTS bar chart essay:
1) Analyse the question
2) Identify the main features
3) Write an introduction
4) Write an overview
5) Write the details paragraphs
Use this simple planning process as you practice writing IELTS bar chart essays and you’ll have no problem remembering it in the exam.
Steps 1 and 2 of the planning process should take around 5 minutes. It is essential that you don’t miss these out as they are the key to writing a high-scoring essay.
On this page, I’m going to take you through the whole planning process step-by-step as we work on a practice question.
Before we begin, here’s a model essay structure that you can use as a guideline for all IELTS Academic Task 1 questions.
Ideally, your essay should have 4 paragraphs:
Paragraph 1 – Introduction
Paragraph 2 – Overview
Paragraph 3 – 1st main feature
Paragraph 4 – 2nd main feature
Now that we have all these tools we need, we’re ready to begin planning and writing our IELTS bar chart essay.
Here’s our practice question:
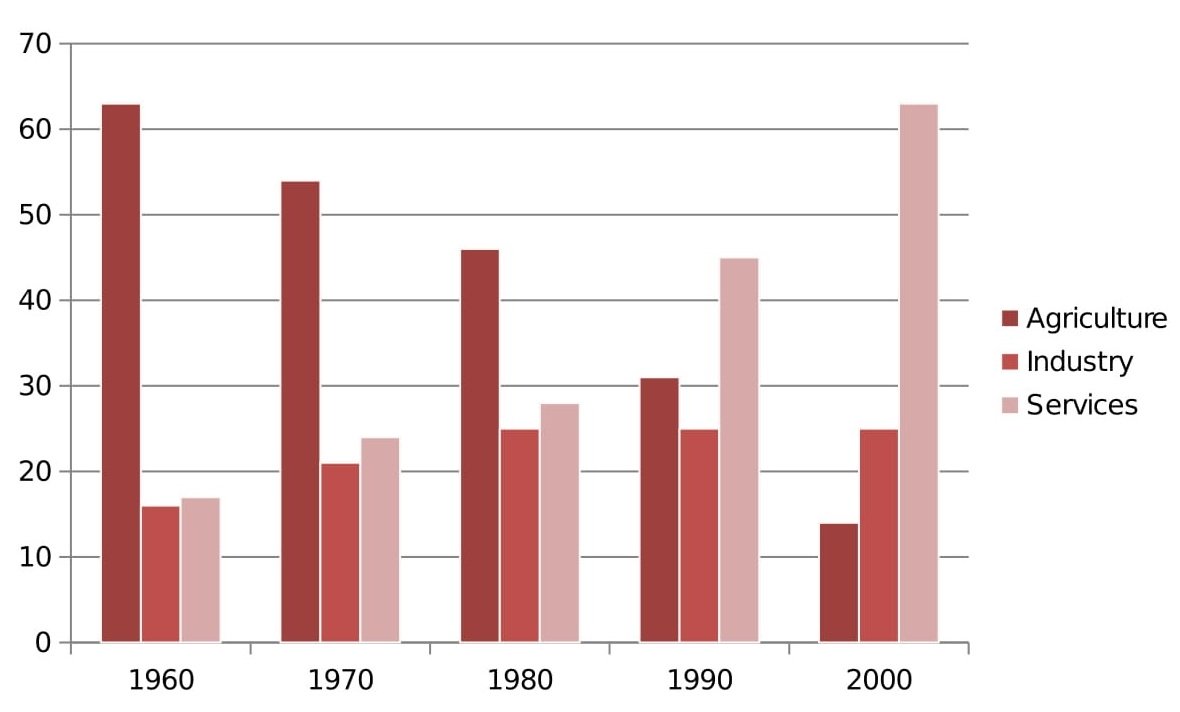
The bar chart below shows the sector contributions to India’s gross domestic product from 1960 to 2000.
Summarise the information by selecting and reporting the main features, and make comparisons where relevant.
Write at least 150 words.
Contribution as % of India's GDP
Source: EPW Research Foundation
Step 1 – Analyse the question
The format of every Academic Task 1 question is the same. Here is our practice question again with the words that will be included in all questions highlighted .
The bar chart below shows the sector contributions to India’s gross domestic product from 1960 to 2000.
Summarise the information by selecting and reporting the main features, and make comparisons where relevant.
Every question consists of:
- Sentence 1 – A brief description of the graphic
- Sentence 2 – The instructions
- The graphic – chart, graph, table, etc.
Sentence 2 tells you what you have to do.
You must do 3 things:
1. Select the main features.
2. Write about the main features.
3. Compare the main features.
All three tasks refer to the ‘main features’ of the graphic. You do not have to write about everything. Just pick out 2 or 3 key features and you’ll have plenty to write about.
Our practice graphic is a dynamic bar chart. That is, it includes a timeline giving data from several different points in time.
So, for this question, we need to identify the main trends (that is, the general developments or changes in situation) in the three key sectors of the Indian economy – agriculture, industry and service – between 1960 and 2000.
Alternatively, a bar chart may be static with the data coming from one point in time, as in the example below. For this graphic, we would need to compare the different variables, that is, the different leisure activities favoured by Canadian boys and girls.

Step 2 – Identify the Main Features
The graphic in IELTS bar chart questions should not be difficult to interpret. Each question has been created to test your language skills, not your mathematics ability.
All you are looking for are the main features. These will usually be the easiest things to spot. As we’ve just seen, the type of key features will depend on whether the bar chart is dynamic or static.
There will be lots of information in the graphic to help you identify them. Here are some useful questions to ask?
- What information do the 2 axes give?
- Is it dynamic or static?
- What are the units of measurements?
- What are the time periods?
- What can you learn from the title and any labels?
- What is the most obvious trend?
- Are there any notable similarities?
(I give more detail on how to use these questions, plus downloadable checklists for identifying the main features of all 7 different types of IELTS Academic Writing Task 1 questions, in the lesson on How To Understand & Analyse Task 1 Questions.)
So, what main features stand out in our practice graphic?
Here's our practice IELTS bar chart again.
Contribution as % of India's GDP
There are 3 main features/trends in this IELTS bar chart:
Main feature 1: The contribution of the agricultural sector dropped steadily.
Main feature 2: The contribution of the service sector increased each decade.
Main feature 3: Industry remained static from 1980 to 2000.
The general trends you select will be the starting point for your essay. You will then go on to add more detail.
With just 20 minutes allowed for Task 1, and a requirement of only 150 words, you won't be able to include many details.
We’re now ready to begin writing our essay. Here’s a reminder of the 4 part structure we’re going to use.
Paragraph 1 – Introduction
Paragraph 2 – Overview
Paragraph 3 – 1st main feature
Paragraph 4 – 2nd main feature
Step 3 – Write an Introduction
In the introduction, you should simply paraphrase the question, that is, say the same thing in a different way. You can do this by using synonyms and changing the sentence structure. For example:
Question:
The bar chart below shows the sector contributions to India’s gross domestic product from 1960 to 2000.
Introduction (Paragraph 1):
The bar graph illustrates the relative percentage contributions made by the agricultural, industrial and service sectors to the Indian economy between 1960 and 2000.
This is all you need to do for the introduction.
Ideally, key words such as ‘sector’ and ‘contributions’ should be replaced by synonyms but there aren’t any obvious words that could be used instead so it’s fine to repeat them. It’s important that your language sounds natural so never try to force in synonyms that don’t quite fit.
Step 4 – Write an Overview (Paragraph 2)
In the second paragraph, you should report the main features you can see in the graph, giving only general information. The detail comes later in the essay. You should also make any clear comparisons you spot.
This is where we write about the general trends. Here are the ones we picked out above.
Main feature 1: The contribution of the agricultural sector dropped steadily.
Main feature 2: The contribution of the service sector increased each decade.
Main feature 3: Industry remained static from 1980 to 2000.
Now form these ideas into two or three sentences with a total of around 40 words. State the information simply using synonyms where possible. No elaborate vocabulary or grammar structures are required, just the appropriate words and correct verb tenses.
For example:
Overview (Paragraph 2):
Over the whole time period, the significance of agriculture declined steadily while services grew in importance decade by decade. A different patterned emerged for industry, which initially showed a slowly increasing percentage but then plateaued from 1980 onwards.
Step 5 – Write the 1st Detail Paragraph
Paragraphs 3 and 4 of your IELTS bar chart essay are where you include more detailed information about the data in the graphic. In paragraph 3, you should give evidence to support your first 1 or 2 key features. Don’t forget to make comparisons when relevant.
Here are our first 2 main features again:
Main feature 1: The contribution of the agricultural sector dropped steadily.
Main feature 2: The contribution of the service sector increased each decade.
And this is an example of what you could write:
Paragraph 3:
In 1960, agriculture contributed by far the highest percentage of GDP, peaking at 62%, but it then dropped in steady increments to a low of 12% in 2000. The service sector, on the other hand, had a relatively minor impact on the economy in 1960. This situation changed gradually at first, then its percentage contribution jumped from 28% to 43% between 1980 and 1990. By 2000 it matched the high point reached by agriculture in 1960, showing a reversal in the overall trend.
Step 6 – Write the 2nd Detail Paragraph
For the fourth and final paragraph, you do the same thing for your remaining feature/s. We have one main feature left to write about.
Main feature 3: Industry remained static from 1980 to 2000.
Here’s an example of what you could write:
Paragraph 4:
Industry remained a steady contributor to India’s wealth throughout the period. As a sector, it grew marginally from 16% in 1960 to exactly a quarter in 1980 then remained static for the next two decades, maintaining a constant share of the overall GDP.
Here are the four paragraphs brought together to create our finished essay.
Finished IELTS Bar Chart Essay
The bar graph illustrates the relative percentage contributions made by the agricultural, industrial and service sectors to the Indian economy between 1960 and 2000.
Over the whole time period, the significance of agriculture declined steadily while services grew in importance decade by decade. A different patterned emerged for industry, which initially showed a slowly increasing percentage but then plateaued from 1980 onwards.
In 1960, agriculture contributed by far the highest percentage of GDP, peaking at 62%, but it then dropped in steady increments to a low of 12% in 2000. The service sector, on the other hand, had a relatively minor impact on the economy in 1960. This situation changed gradually at first, then its percentage contribution jumped from 28% to 43% between 1980 and 1990. By 2000 it matched the high point reached by agriculture in 1960, showing a reversal in the overall trend.
Industry remained a steady contributor to India’s wealth throughout the period. As a sector, it grew marginally from 16% in 1960 to exactly a quarter in 1980 then remained static for the next two decades, maintaining a constant share of the overall GDP.
(188 words)
This sample IELTS bar chart essay is well over the minimum word limit so you can see that you don’t have space to include very much detail at all. That’s why it is essential to select just a couple of main features to write about.
Now use what you’ve learnt in this lesson to practice answering other IELTS bar chart questions. Start slowly at first and keep practicing until you can plan and write a complete essay in around 20 minutes.
Want to watch and listen to this lesson?
Click on this video.
IELTS Academic Writing Task 1 – All Lessons
IELTS Academic Writing – A summary of the test including important facts, test format & assessment.
Academic Writing Task 1 – The format, the 7 question types & sample questions, assessment & marking criteria. All the key information you need to know.
Understanding Task 1 Questions – How to quickly and easily analyse and understand IELTS Writing Task 2 questions.
How To Plan a Task 1 Essay – Discover 3 reasons why you must plan, the 4 simple steps of essay planning and learn a simple 4 part essay structure.
Vocabulary for Task 1 Essays – Learn key vocabulary for a high-scoring essay. Word lists & a downloadable PDF.
Grammar for Task 1 Essays – Essential grammar for Task 1 Academic essays including, verb tenses, key sentence structures, articles & prepositions.
The 7 Question Types:
Click the links below for a step-by-step lesson on each type of Task 1 question.


Testimonials
“I am very excited to have found such fabulous and detailed content. I commend your good work.” Jose M.
“Thanks for the amazing videos.
These are ‘to the point’, short videos, beautifully explained with practical
examples." Adari J.
"Hi Jacky, I bought a listening book from you this morning. You know what? I’m 100% satisfied. It’s super helpful. If I’d had the chance to read this book 7 years ago, my job would be very different now." Loi H.
"Hi Jacky, I recently
got my IELTS results and I was pleased to discover that I got an 8.5 score. I'm
firmly convinced your website and your videos played a strategic role in my
preparation. I was able to improve my writing skills thanks to the effective
method you provide. I also only relied on your tips regarding the reading
section and I was able to get a 9! Thank you very much." Giano
“After listening to your videos, I knew I had to ditch
every other IELTS tutor I'd been listening to. Your explanations are clear and
easy to understand. Anyways, I took the test a few weeks ago and my result came
back: Speaking 7, listening 9, Reading 8.5 and Writing 7 with an average band
score of 8. Thanks, IELTS Jacky." Laide Z.