How To Write an
IELTS Table Chart Essay
There are 5
steps to writing a high-scoring IELTS table chart essay:
1) Analyse the question
2) Identify the main features
3) Write an introduction
4) Write an overview
5) Write the details paragraphs
I want to start by highlighting the importance of steps 1 and 2. It is essential that you learn how to do this planning stage properly if you hope to write a high-scoring essay.
Many students are reluctant to spend time on the first two steps as they want to use as much of the 20 minutes allowed for the essay as possible writing rather than planning. However, it is important that you do them as they are the key to getting high marks for your IELTS table chart essay.
In this lesson, we’re going to work through the 5 stages step-by-step as we answer a practice question.
Before we begin, here’s a model essay structure that you can use as a guideline for all IELTS Academic Task 1 questions.
Ideally, your essay should have 4 paragraphs:
Paragraph 1 – Introduction
Paragraph 2 – Overview
Paragraph 3 – 1st main feature
Paragraph 4 – 2nd main feature
We now have everything we need to begin planning and writing our IELTS table chart essay.
Here’s our practice question:
The tables below give the distribution of world population in 1950 and 2000, with an estimate of the situation in 2050.
Summarise the information by selecting and reporting the main features, and make comparisons where relevant.
Write at least 150 words.
Step 1 – Analyse the question
The format of every Academic Task 1 question is the same, with the instruction sentence (highlighted below) identical in every question. Here is our practice question again.
The
tables below give the distribution of world population in 1950 and 2000, with an estimate of the situation in
2050.
Summarise the information by selecting and reporting the main features, and make comparisons where relevant.
Every question consists of:
- Sentence 1 – A brief description of the graphic
- Sentence 2 – The instructions
- The graphic – chart, graph, table, etc.
Sentence 2 tells you what you have to do.
You must do 3 things:
1. Select the main features.
2. Write about the main features.
3. Compare the main features.
All three tasks refer to the ‘main features’ of the graphic. You do not have to write about everything. Just pick out 2 or 3 key features and you’ll have plenty to write about.
Step 2 – Identify the Main Features
Some students find IELTS table chart questions more
difficult to interpret than other types of graphic as they are just sets of
numbers with no visual representation. However, they are not as complicated as
they may at first look. Remember, the IELTS exam is designed to test your
language skills, not your mathematics ability.
All you are looking for are the main features. However, this can be a challenge as tables generally contain a lot of information, making it difficult to pick out the key features. Use the information in the graphic to help you identify them.
Here are some useful questions to ask?
- What are the units of measurements?
- What are the time periods?
- What can you learn from the title and any labels?
- What is the most obvious trend?
- Are there any notable similarities?
(I give more detail on how to use these questions, plus downloadable checklists for identifying the main features of all 7 different types of IELTS Academic Writing Task 1 questions, in the lesson on How To Understand & Analyse Task 1 Questions.)
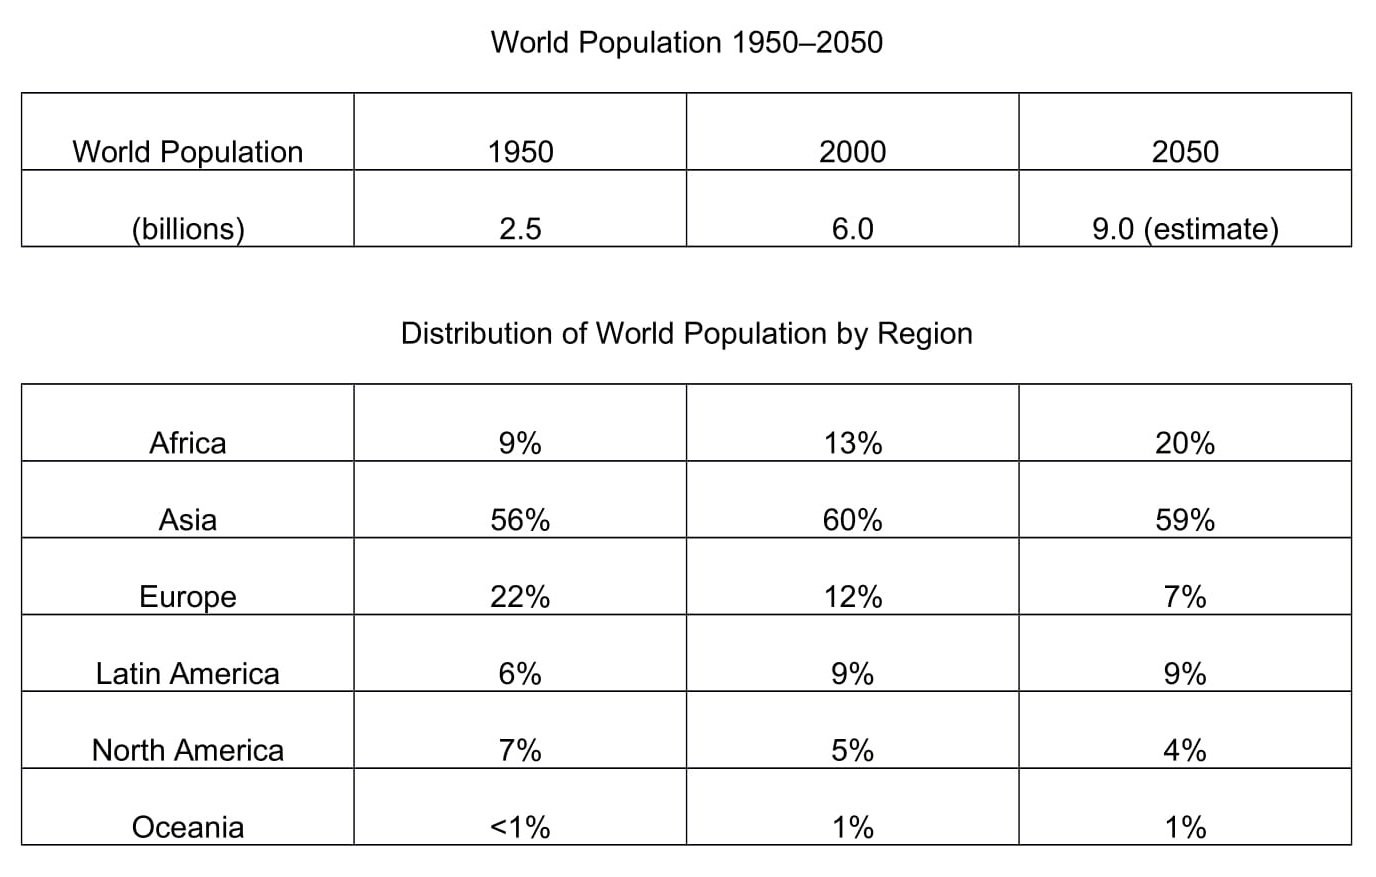
So, what information is contained in this graphic?
Here's our IELTS table chart again.
The key to understanding it is to use the clues given
in the title, the row and column headings and the units of measurement.
For example, the title of the table tells us that it shows changes in world population from 1950 to projected levels in 2050.
The world is divided into regions (Africa, Asia, etc.) and data is given for three specific years – 1950, 2000 and projected data for 2050. This is a clue that we will need to use past, present and futures tenses in our essay.
In the first table, the units of measurement are billions of people and in the second table, percentages of the total world population are used.
Don’t look at the numbers in detail at this stage. Instead, focus on general trends. What are the most notable changes in data between 1950 and projected figures for 2050?
There are a number of different features we could select from this IELTS table chart. Here are the three that I’ve chosen:
Main feature 1: The only region where the percentage is expected to increase by 2050 is Africa.
Main feature 2: Europe is expected to have the greatest drop in percentage contribution by 2050.
Main feature 3: The only region showing a fluctuation in percentage contribution over the whole time period is Asia.
The key features you select will be the starting point for your essay. You will then go on to add more detail later. However, with just 20 minutes allowed for Task 1, and a requirement of only 150 words, you won't be able to include many details.
We’re now ready to begin writing our essay. Here’s a reminder of the 4 part structure we’re going to use.
Paragraph 1 – Introduction
Paragraph 2 – Overview
Paragraph 3 – 1st main feature
Paragraph 4 – 2nd main feature
Step 3 – Write an Introduction
In the introduction, you should simply paraphrase the question, that is, say the same thing in a different way. You can do this by using synonyms and changing the sentence structure. For example:
Question:
The tables below give the distribution of world population in 1950 and 2000, with an estimate of the situation in 2050.
Introduction (Paragraph 1):
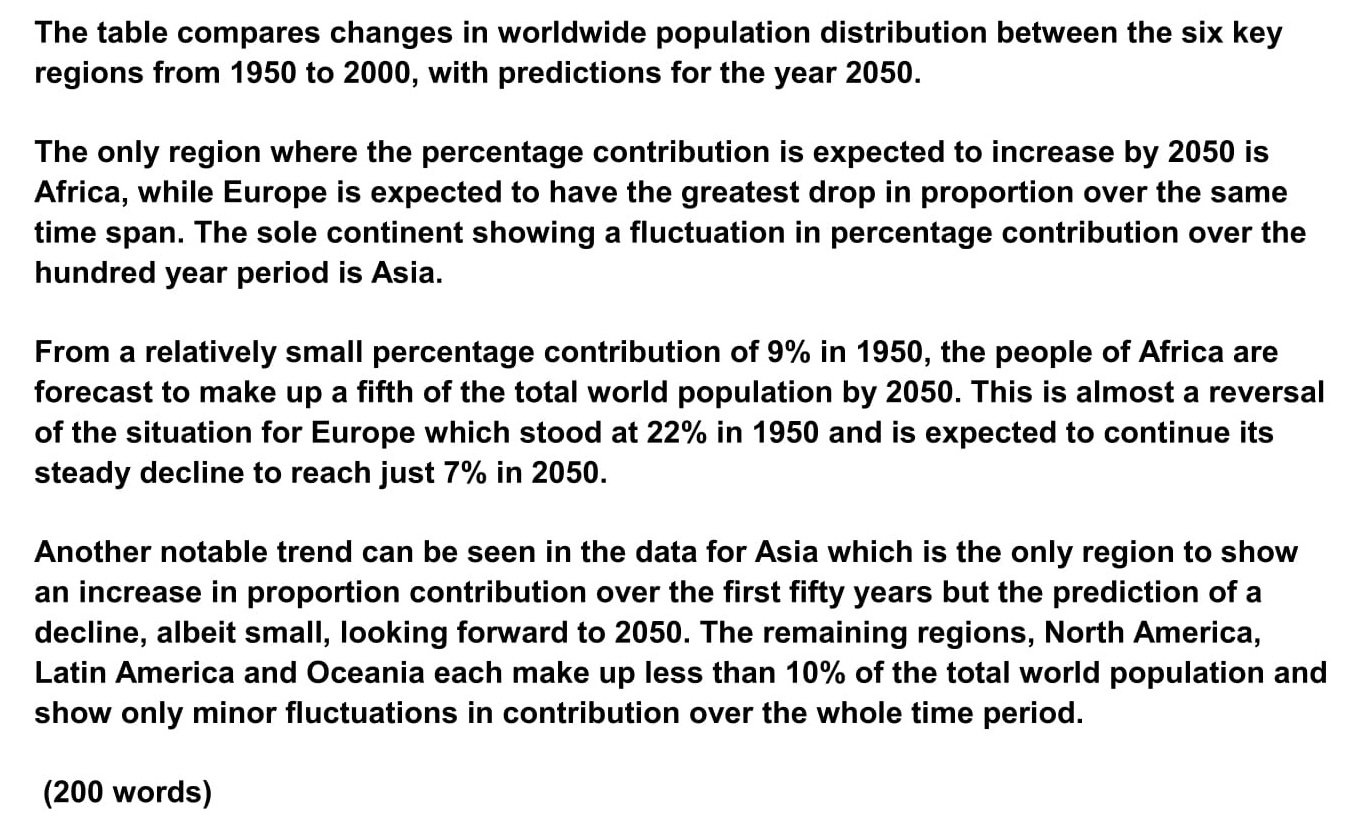
The table compares changes in worldwide population distribution between the six key regions from 1950 to 2000, with predictions for the year 2050.
This is all you need to do for the introduction.
Step 4 – Write an Overview (Paragraph 2)
In the second paragraph, you should report the main features you can see in the table, giving only general information. The detail comes later in the essay. You should also make any clear comparisons you spot.
Here are the key features we picked out above.
Main feature 1: The only region where the percentage is expected to increase by 2050 is Africa.
Main feature 2: Europe is expected to have the greatest drop in percentage contribution by 2050.
Main feature 3: The only region showing a fluctuation in percentage contribution over the whole time period is Asia.
Now form these ideas into two or three sentences with a total of around 40 words. State the information simply, using synonyms where possible. No elaborate vocabulary or grammar structures are required, just the appropriate words and correct verb tenses.
For example:
Overview (Paragraph 2):
The only region where the percentage contribution is expected to increase by 2050 is Africa, while Europe is expected to have the greatest drop in proportion over the same time span. The sole continent showing a fluctuation in percentage contribution over the hundred year period is Asia.
Step 5 – Write the 1st Detail Paragraph
Paragraphs 3 and 4 of your IELTS table chart essay are where you include more detailed information about the data in the graphic. In paragraph 3, you should give evidence to support your first 1or 2 key features. Don’t forget to make comparisons where relevant.
Here are the first two again:
Main feature 1: The
only region where the percentage is expected to increase by 2050 is Africa.
Main feature 2: Europe is expected to have the greatest drop in percentage contribution by 2050.
And this is an example of what you could write:
Paragraph 3:
From a relatively small percentage contribution of 9% in 1950, the people of Africa are forecast to make up a fifth of the total world population by 2050. This is almost a reversal of the situation for Europe which stood at 22% in 1950 and is expected to continue its steady decline to reach just 7% in 2050.
Step 6 – Write the 2nd Detail Paragraph
For the fourth and final paragraph, you do the same thing for your remaining key features.
Main feature 3: The only region showing a fluctuation in percentage contribution over the whole time period is Asia.
Here’s an example of what you could write:
Paragraph 4:
Another notable trend can be seen in the data for Asia which is the only region to show an increase in proportion contribution over the first fifty years but the prediction of a decline, albeit small, looking forward to 2050. The remaining regions, North America, Latin America and Oceania each make up less than 10% of the total world population and show only minor fluctuations in contribution over the whole time period.
It’s best to mention all the
regions if at all possible but you could get away with missing out the last
sentence if really pushed for time.
Here are the four paragraphs brought together to create our finished essay.
Finished IELTS Table Chart Essay
This sample IELTS table chart essay is well over the minimum word limit so you can see that you don’t have space to include very much detail at all. That’s why it is essential to select just a couple of main features to write about.
Now use what you’ve learnt in this lesson to practice answering other IELTS table chart questions. Start slowly at first and keep practicing until you can plan and write a complete essay in around 20 minutes.
Want to watch and listen to this lesson?
Click on this video.
IELTS Academic Writing Task 1 – All Lessons
IELTS Academic Writing – A summary of the test including important facts, test format & assessment.
Academic Writing Task 1 – The format, the 7 question types & sample questions, assessment & marking criteria. All the key information you need to know.
Understanding Task 1 Questions – How to quickly and easily analyse and understand IELTS Writing Task 2 questions.
How To Plan a Task 1 Essay – Discover 3 reasons why you must plan, the 4 simple steps of essay planning and learn a simple 4 part essay structure.
Vocabulary for Task 1 Essays – Learn key vocabulary for a high-scoring essay. Word lists & a downloadable PDF.
Grammar for Task 1 Essays – Essential grammar for Task 1 Academic essays including, verb tenses, key sentence structures, articles & prepositions.
The 7 Question Types:
Click the links below for a step-by-step lesson on each type of Task 1 question.


Testimonials
“I am very excited to have found such fabulous and detailed content. I commend your good work.” Jose M.
“Thanks for the amazing videos.
These are ‘to the point’, short videos, beautifully explained with practical
examples." Adari J.
"Hi Jacky, I bought a listening book from you this morning. You know what? I’m 100% satisfied. It’s super helpful. If I’d had the chance to read this book 7 years ago, my job would be very different now." Loi H.
"Hi Jacky, I recently
got my IELTS results and I was pleased to discover that I got an 8.5 score. I'm
firmly convinced your website and your videos played a strategic role in my
preparation. I was able to improve my writing skills thanks to the effective
method you provide. I also only relied on your tips regarding the reading
section and I was able to get a 9! Thank you very much." Giano
“After listening to your videos, I knew I had to ditch
every other IELTS tutor I'd been listening to. Your explanations are clear and
easy to understand. Anyways, I took the test a few weeks ago and my result came
back: Speaking 7, listening 9, Reading 8.5 and Writing 7 with an average band
score of 8. Thanks, IELTS Jacky." Laide Z.