How To Write an
IELTS Line Graph Essay
Here is the 5
steps process I recommend for planning and writing IELTS line graph essays:
1) Analyse the question
2) Identify the main features
3) Write an introduction
4) Write an overview
5) Write the details paragraphs
I’m going to take you through the whole process step-by-step as we work on a practice question.
Many students are reluctant to spend time on steps 1 and 2 as they want to spend as much of the 20 minutes allowed for the essay as possible actually writing it. However, it is essential that you do them as they are the key to writing a high-scoring IELTS line graph essay.
Before we begin, here’s a model essay structure that you can use as a guideline for all IELTS Academic Task 1 questions.
Ideally, your essay should have 4 paragraphs:
Paragraph 1 – Introduction
Paragraph 2 – Overview
Paragraph 3 – 1st main feature
Paragraph 4 – 2nd main feature
Now that we have all these tools we need, we’re ready to begin planning and writing our IELTS line graph essay.
Here’s our practice question:
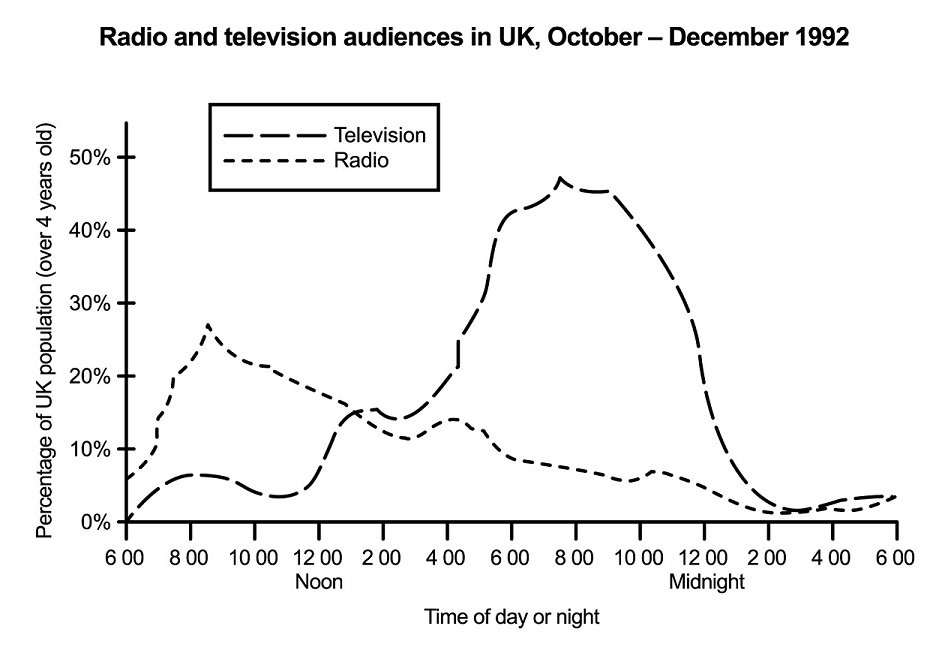
The graph below shows radio and television audiences throughout the day in 1992.
Summarise the information by selecting and reporting the main features, and make comparisons where relevant.
Write at least 150 words.
Source: Official IELTS website
Step 1 – Analyse the question
The format of every Academic Task 1 question is the same. Here is our practice question again with the words that will be included in all questions highlighted .
The graph below shows radio and television audiences
throughout the day in 1992.
Summarise the information by selecting and reporting the main features, and make comparisons where relevant.
Every question consists of:
- Sentence 1 – A brief description of the graphic
- Sentence 2 – The instructions
- The graphic – chart, graph, table, etc.
Sentence 2 tells you what you have to do.
You must do 3 things:
1. Select the main features.
2. Write about the main features.
3. Compare the main features.
All three tasks refer to the ‘main features’ of the graphic. You do not have to write about everything. Just pick out 2 or 3 key features and you’ll have plenty to write about.
Step 2 – Identify the Main Features
The graphic in IELTS line graph questions should not be difficult to interpret. Each question has been created to test your language skills, not your mathematics ability.
All you are looking for are the main features. These will usually be the easiest things to spot. There will be lots of information in the graphic to help you identify them.
Here are some useful questions to ask?
- What information do the 2 axes give?
- What are the units of measurements?
- What are the time periods?
- What can you learn from the title and any labels?
- What is the most obvious trend?
- Are there any notable similarities?
(I give more detail on how to use these questions, plus downloadable checklists for identifying the main features of all 7 different types of IELTS Academic Writing Task 1 questions, in the lesson on How To Understand & Analyse Task 1 Questions.)
So, what main features stand out in our practice graphic?
Here's our IELTS line graph again.
The timeline will give you the biggest clues as to the most significant trends. Look for general trends.
There are 2 main features/trends in this line graph:
Main feature 1: The peak time for TV audiences is in the evening (8 pm).
Main feature 2: The peak time for radio audiences is in the morning (8 am).
The general trends you select will be the starting point for your essay. You will then go on to add more detail. However, with just 20 minutes allowed for Task 1, and a requirement of only 150 words, you won't be able to include many details.
We’re now ready to begin writing our essay. Here’s a reminder of the 4 part structure we’re going to use.
Paragraph 1 – Introduction
Paragraph 2 – Overview
Paragraph 3 – 1st main feature
Paragraph 4 – 2nd main feature
Step 3 – Write an Introduction
In the introduction, you should simply paraphrase the question, that is, say the same thing in a different way. You can do this by using synonyms and changing the sentence structure. For example:
Question:
The graph below shows radio and television audiences throughout the day in 1992.
Introduction (Paragraph 1):
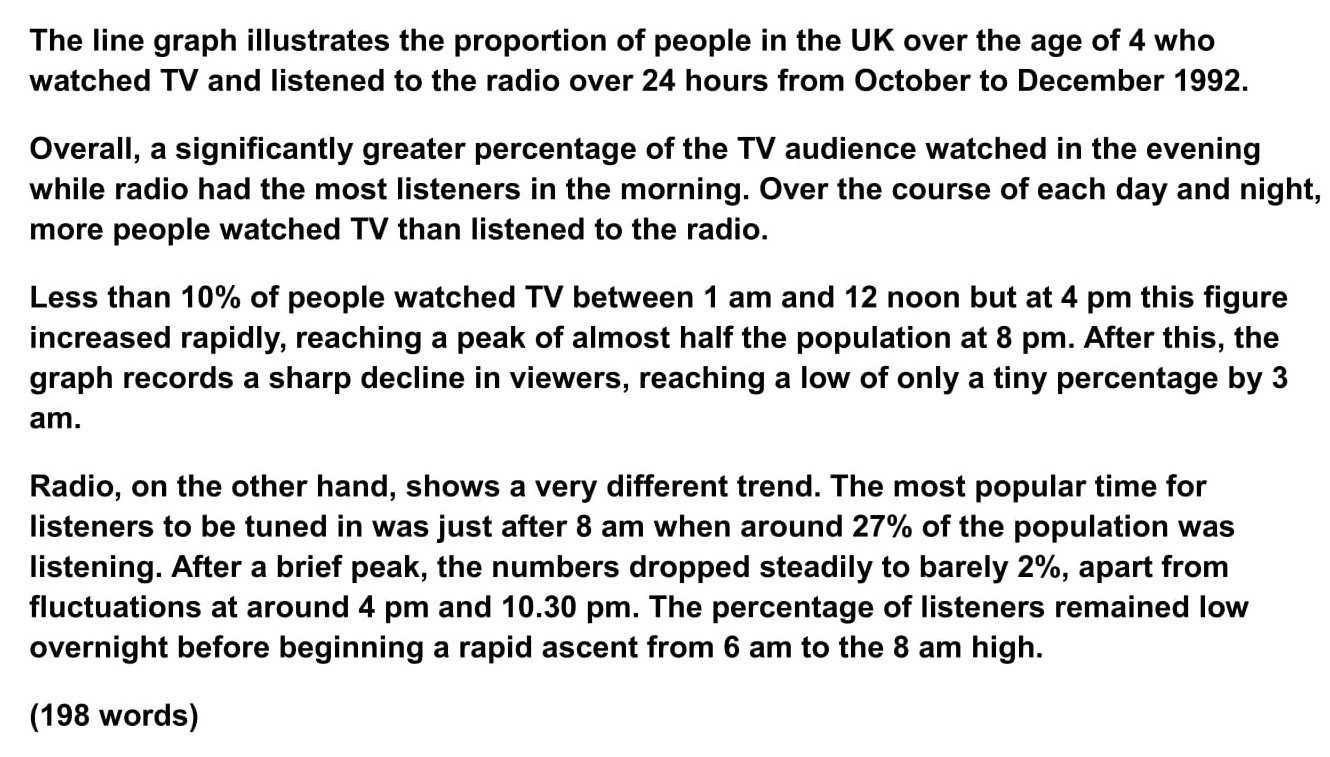
The line graph illustrates the proportion of people in the UK who watched TV and listened to the radio over 24 hours from October to December 1992.
This is all you need to do for the introduction.
Step 4 – Write an Overview (Paragraph 2)
In the second paragraph, you should report the main features you can see in the graph, giving only general information. The detail comes later in the essay. You should also make any clear comparisons you spot.
This is where we write about the general trends. Here are the ones we picked out above.
Main feature 1: The peak time for TV audiences is in the evening (8 pm).
Main feature 2: The peak time for radio audiences is in the morning (8 am).
Now form these ideas into two or three sentences with a total of around 40 words. State the information simply using synonyms where possible. No elaborate vocabulary or grammar structures are required, just the appropriate words and correct verb tenses.
For example:
Overview (Paragraph 2):
Overall, a significantly greater
percentage of the TV audience watched in the evening while radio had the most
listeners in the morning. Over the course of each day and night, more people
watched TV than listened to the radio.
Step 5 – Write the 1st Detail Paragraph
Paragraphs 3 and 4 of your IELTS line graph essay are where you include more detailed information about the data in the graphic. In paragraph 3, you should give evidence to support your first key feature. Don’t forget to make comparisons when relevant.
Here is our first main feature again:
Main feature 1: The peak time for TV audiences is in the evening (8 pm).
And this is an example of what you could write:
Paragraph 3:
Less than 10% of people
watched TV between 1 am and 12 noon but at 4 pm this figure increased rapidly,
reaching a peak of almost half the population at 8 pm. After this, the graph
records a sharp decline in viewers, reaching a low of only a tiny percentage by
3 am.
Step 6 – Write the 2nd Detail Paragraph
For the fourth and final paragraph, you do the same thing for your second key feature.
Main feature
2: The peak time for radio audiences is in the morning (8 am).
Here’s an example of what you could write:
Paragraph 4:
Radio, on the other
hand, shows a very different trend. The most popular time for listeners to be
tuned in was just after 8 am when around 27% of the population was listening. After
a brief peak, the numbers dropped steadily to barely 2%, apart from fluctuations at around 4 pm and 10.30 pm. The percentage of listeners remained low
overnight before beginning a rapid ascent from 6 am to the 8 am high.
Here are the four paragraphs brought together to create our finished essay.
Finished IELTS Line Graph Essay
This sample IELTS line graph essay is well over the minimum word limit so you can see that you don’t have space to include very much detail at all. That’s why it is essential to select just a couple of main features to write about.
Now use what you’ve learnt in this lesson to practice answering other IELTS line graph questions. Start slowly at first and keep practicing until you can plan and write a complete essay in around 20 minutes.
Want to watch and listen to this lesson?
Click on this video.
IELTS Academic Writing Task 1 – All Lessons
IELTS Academic Writing – A summary of the test including important facts, test format & assessment.
Academic Writing Task 1 – The format, the 7 question types & sample questions, assessment & marking criteria. All the key information you need to know.
Understanding Task 1 Questions – How to quickly and easily analyse and understand IELTS Writing Task 2 questions.
How To Plan a Task 1 Essay – Discover 3 reasons why you must plan, the 4 simple steps of essay planning and learn a simple 4 part essay structure.
Vocabulary for Task 1 Essays – Learn key vocabulary for a high-scoring essay. Word lists & a downloadable PDF.
Grammar for Task 1 Essays – Essential grammar for Task 1 Academic essays including, verb tenses, key sentence structures, articles & prepositions.
The 7 Question Types:
Click the links below for a step-by-step lesson on each type of Task 1 question.

Testimonials
“I am very excited to have found such fabulous and detailed content. I commend your good work.” Jose M.
“Thanks for the amazing videos.
These are ‘to the point’, short videos, beautifully explained with practical
examples." Adari J.
"Hi Jacky, I bought a listening book from you this morning. You know what? I’m 100% satisfied. It’s super helpful. If I’d had the chance to read this book 7 years ago, my job would be very different now." Loi H.
"Hi Jacky, I recently
got my IELTS results and I was pleased to discover that I got an 8.5 score. I'm
firmly convinced your website and your videos played a strategic role in my
preparation. I was able to improve my writing skills thanks to the effective
method you provide. I also only relied on your tips regarding the reading
section and I was able to get a 9! Thank you very much." Giano
“After listening to your videos, I knew I had to ditch
every other IELTS tutor I'd been listening to. Your explanations are clear and
easy to understand. Anyways, I took the test a few weeks ago and my result came
back: Speaking 7, listening 9, Reading 8.5 and Writing 7 with an average band
score of 8. Thanks, IELTS Jacky." Laide Z.