How To Write an
IELTS Multiple Graph Essay
IELTS multiple
graph questions are quite common in the Academic Task 1 Writing test. Students
often panic when they see these as they are worried about having to interpret two
different types of data.
However, as long as you’ve learnt how to write essays on each type of graph, you will have no problem with multiple graphs questions.
A question could include any combination of the following:
You'll find lessons on each of them via the links above or in the menu at the bottom of this page.
The process for planning and writing IELTS multiple graph essays is the same as for any other Academic Task 1 essay.
Here is the 5 steps process I recommend that you use:
1) Analyse the question
2) Identify the main features
3) Write an introduction
4) Write an overview
5) Write the details paragraphs
I’m going to take you through the whole process step-by-step as we work on a practice question.
Before we begin, here’s a model essay structure that you can use as a guideline for all IELTS Academic Task 1 questions.
Ideally, your essay should have 4 paragraphs:
Paragraph 1 – Introduction
Paragraph 2 – Overview
Paragraph 3 – Details of 1st graph or chart
Paragraph 4 – Details of 2nd graph or chart
Now that we have all these tools we need, we’re ready to begin planning and writing our IELTS multiple graph essay.
Here’s our
practice question, which includes a pie chart and a table:
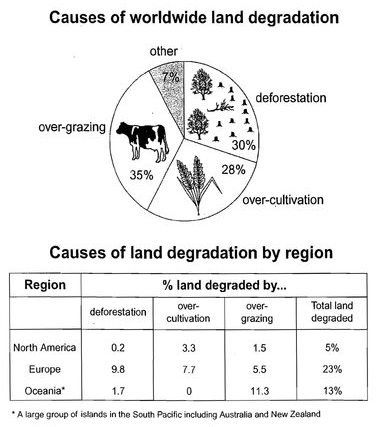
The pie chart shows the main reasons why agricultural land becomes less productive. The table shows how these causes affected three regions of the world during the 1990s.
Summarise the information by selecting and reporting the main features, and make comparisons where relevant.
Write at least 150 words.
Source: IELTS past paper
Step 1 – Analyse the question
The format of every Academic Task 1 question is the same, with the instruction sentence (highlighted below) identical in every question. Here is our practice question again.
The pie chart shows the main reasons
why agricultural land becomes less productive. The table shows how these causes
affected three regions of the world during the 1990s.
Summarise the information by selecting and reporting the main features, and make comparisons where relevant.
Every question consists of:
- Sentence 1 – A brief description of the graphic
- Sentence 2 – The instructions
- The graphic – chart, graph, table, etc.
Sentence 2 tells you what you have to do.
You must do 3 things:
1. Select the main features.
2. Write about the main features.
3. Compare the main features.
All three tasks refer to the ‘main features’ of the graphic. You do not have to write about everything. Just pick out 2 or 3 key features and you’ll have plenty to write about.
Step 2 – Identify the Main Features
The graphics
in IELTS multiple graph questions should not be difficult to interpret. Each
question has been created to test your
language skills, not your mathematics ability.
All you are looking for are the main features. These will usually be the easiest things to spot. In most Task 1 questions, you will be looking for two main features in one graph, chart or table. In multiple graph questions, look for one main feature in each graphic.
There will be lots of information in the graphics to help you identify them.
Here are some useful questions to ask? The first question relates specifically to bar charts and line graphs but the rest apply to all graph and chart types.
- What information do the 2 axes give?
- What are the units of measurements?
- What are the time periods?
- What can you learn from the title and any labels?
- What is the most obvious trend?
- Are there any notable similarities?
(I give more detail on how to use these questions, plus downloadable checklists for identifying the main features of all 7 different types of IELTS Academic Writing Task 1 questions, in the lesson on How To Understand & Analyse Task 1 Questions.)
So, what main feature stands out in each of the graphics in our practice question? Here are the pie chart and table again.
The main features are:
Pie chart: The biggest cause of land degradation worldwide is over-grazing.
Table: Europe had the highest percentage of degraded land.
We’re now ready to begin writing our essay. Here’s a reminder of the 4 part structure we’re going to use.
Paragraph 1 – Introduction
Paragraph 2 – Overview
Paragraph 3 – Details of 1st graph or chart
Paragraph 4 – Details of 2nd graph or chart
Step 3 – Write an Introduction
In the introduction, you should simply paraphrase the question, that is, say the same thing in a different way. You can do this by using synonyms and changing the sentence structure. For example:
Question:
The pie chart shows the main reasons why agricultural land becomes less productive. The table shows how these causes affected three regions of the world during the 1990s.
Introduction (Paragraph 1):
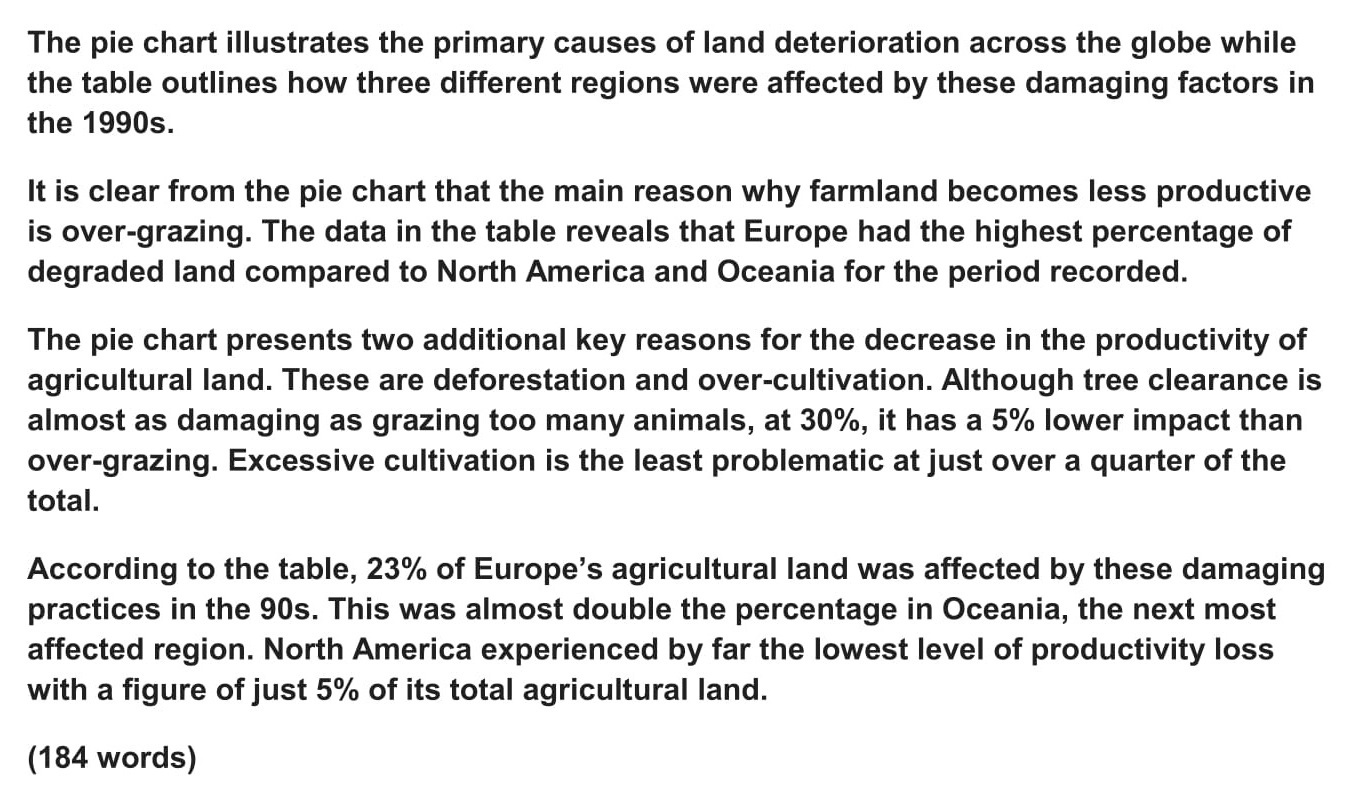
The pie chart illustrates the primary causes of land deterioration across the globe while the table outlines how three different regions were affected by these damaging factors in the 1990s.
This is all you need to do for the introduction.
Step 4 – Write an Overview (Paragraph 2)
In the second
paragraph, you should report the main features you have identified, giving only
general information. The detail comes later in the essay. However,
with just 20 minutes allowed for Task 1, and a requirement of only 150 words,
you won't be able to include many details.
Here are the features we picked out above.
Pie chart: The biggest cause of land degradation worldwide is over-grazing.
Table: Europe had the highest percentage of degraded land.
Now form these ideas into two or three sentences with a total of around 40 words. State the information simply using synonyms where possible. No elaborate vocabulary or grammar structures are required, just the appropriate words and correct verb tenses.
For example:
Overview (Paragraph 2):
It is clear from the pie chart that the main reason why
farmland becomes less productive is over-grazing. The data in the table reveals
that Europe had the highest percentage of degraded land compared to North
America and Oceania for the period recorded.
Step 5 – Write the 1st Detail Paragraph
Paragraphs 3 and 4 of your IELTS multiple graph essay are where you include more detailed information about the data in the graphics. In paragraph 3, you should give evidence to support your first key feature.
Here it is again:
Pie chart: The biggest cause of land degradation worldwide is
over-grazing.
And this is an example of what you could write:
Paragraph 3:
The pie chart presents two additional key reasons for the
decrease in the productivity of agricultural land. These are deforestation
and over-cultivation. Although tree clearance is almost as damaging as grazing
too many animals, at 30%, it has a 5% lower impact than over-grazing. Excessive cultivation is the least problematic at just over a quarter of the total.
Step 6 – Write the 2nd Detail Paragraph
For the fourth and final paragraph, you do the same thing for your second key feature.
Table: Europe had the highest percentage of degraded land.
Here’s an example of what you could write:
Paragraph 4:
According to the table, 23% of Europe’s agricultural land was affected by these damaging practices. This was almost double the percentage in Oceania, the next most affected region. North America experienced by far the lowest level of productivity loss with a figure of just 5% of its total agricultural land.
Here are the four paragraphs brought together to create our finished essay.
Finished IELTS Multiple Graph Essay
This sample essay is over the minimum word limit so you can see that you don’t have space to include very much detail at all. That’s why it is essential to select just a couple of main features to write about.
Now use what you’ve learnt in this lesson to practice answering other IELTS multiple graph questions. Start slowly at first and keep practicing until you can plan and write a complete essay in around 20 minutes.
Want to watch and listen to this lesson on how to write an IELTS Multiple Graph essay?
Click on this video.
IELTS Academic Writing Task 1 – All Lessons
IELTS Academic Writing – A summary of the test including important facts, test format & assessment.
Academic Writing Task 1 – The format, the 7 question types & sample questions, assessment & marking criteria. All the key information you need to know.
Understanding Task 1 Questions – How to quickly and easily analyse and understand IELTS Writing Task 2 questions.
How To Plan a Task 1 Essay – Discover 3 reasons why you must plan, the 4 simple steps of essay planning and learn a simple 4 part essay structure.
Vocabulary for Task 1 Essays – Learn key vocabulary for a high-scoring essay. Word lists & a downloadable PDF.
Grammar for Task 1 Essays – Essential grammar for Task 1 Academic essays including, verb tenses, key sentence structures, articles & prepositions.
The 7 Question Types:
Click the links below for a step-by-step lesson on each type of Task 1 question.


Testimonials
“I am very excited to have found such fabulous and detailed content. I commend your good work.” Jose M.
“Thanks for the amazing videos.
These are ‘to the point’, short videos, beautifully explained with practical
examples." Adari J.
"Hi Jacky, I bought a listening book from you this morning. You know what? I’m 100% satisfied. It’s super helpful. If I’d had the chance to read this book 7 years ago, my job would be very different now." Loi H.
"Hi Jacky, I recently
got my IELTS results and I was pleased to discover that I got an 8.5 score. I'm
firmly convinced your website and your videos played a strategic role in my
preparation. I was able to improve my writing skills thanks to the effective
method you provide. I also only relied on your tips regarding the reading
section and I was able to get a 9! Thank you very much." Giano
“After listening to your videos, I knew I had to ditch
every other IELTS tutor I'd been listening to. Your explanations are clear and
easy to understand. Anyways, I took the test a few weeks ago and my result came
back: Speaking 7, listening 9, Reading 8.5 and Writing 7 with an average band
score of 8. Thanks, IELTS Jacky." Laide Z.