IELTS Reading Practice – Sample 12
Populations pyramids:
Powerful predictors of the future
Match the sentences below to the list of countries with the information in the reading passage.
Then, scroll down to the bottom of the page for the answers.
Questions
Look at the following ideas (Questions 1-4) and the list of countries below.
Match each idea with the correct country, A-F.
1. This population reflects
government intervention.
2. This population reflects the loss of males during the Second World War.
3. This country has a very young population.
4. Most of the population of this country is over childbearing age.
Countries
A Japan
B China
C Rwanda
D United States
E Russia
F Canada
Reading passage:
Populations pyramids: Powerful predictors of the future
Russia, with the largest
territory in the world, has roughly the same total population as Nigeria, a
country 1/16 its size. But this similarity won't last long. One of the
populations is rapidly growing, while the other is slowly declining. What can
this tell us about the two countries?
Population statistics are some of the most important data social scientists and policy experts have to work with. But understanding a country's situation and making accurate predictions requires knowing not just the total size of the population but its internal characteristics, such as age and gender distribution. So, how can we keep track of all that data in a way that makes it easy to comprehend?
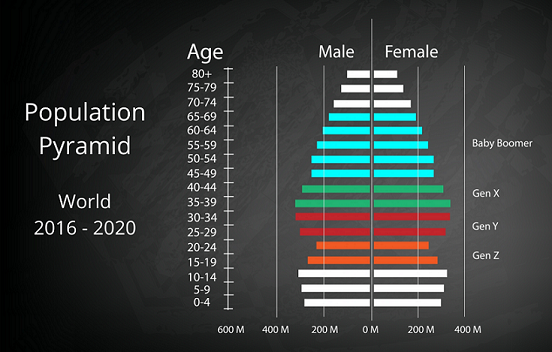
Complex data is more easily interpreted through visualisation and one of the ways that demographers represent the internal distribution of a population is the population pyramid. Here, the data is divided by gender with females on one side and males on the other. The population numbers are shown for each five-year age interval, starting from 0-4 and continuing up to 100 and up. These intervals are grouped together into pre-reproductive (0-14), reproductive (15-44), and post-reproductive years (45 and up).
Such a population pyramid can be a powerful predictor of future population trends. For example, Rwanda's population pyramid shows it to be a fast-growing country, with most of the population being in the youngest age groups at the bottom of the pyramid. The number will grow rapidly in the coming years. As today's children reach their reproductive years and have children of their own, the total population is almost certain to double within the next few decades.
For our second example, let's look at Canada where most of the population is clustered around the middle of the graph. Because there are fewer people in the pre-reproductive age groups than there are in the reproductive ones, the population will grow more slowly, as the number of people reaching their reproductive years’ decreases.
Finally, let's look at Japan. Because the majority of its population is in its post-reproductive years and the number of people is smaller at each younger interval, this means that at current rates of reproduction the population will begin to decline as fewer and fewer people reach reproductive age. Comparing these three population pyramids side by side shows us three different stages in a demographic transition as a country moves from a pre-industrial society to one with an industrial or post-industrial economy.
Countries that have only recently begun the process of industrialisation typically see an increase in life expectancy and a fall in child mortality rates as a result of improvements in medicine, sanitation and food supply. Birth rates remain constant, leading to a population boom. Developing countries that are farther along in the industrialisation process begin to see a fall in birth rates due to factors such as increased education and opportunities for women outside of child-rearing and a move from rural to urban living that makes having large families less economically advantageous. Finally, countries in advanced stages of industrialisation reach a point where both birth and death rates are low and the population remains stable or even begins to decline.
Now, let's consider the projected population pyramids for the same three countries in 2050. What do these tell us about the expected changes in each country's population and what kinds of factors can alter the shape of these future pyramids? A population pyramid can be useful not only as a predictor of a country's future but as a record of its past. Russia's population pyramid still bears the scars of World War II, which explains both the fewer numbers of elderly men compared to elderly women and the relatively sudden population increase as soldiers returned from the war and normal life resumed.
China's population pyramid reflects the establishment of the one-child policy 35 years before, which prevented a population boom such as that of Rwanda. However, it also led to sex-selective abortions, resulting in more male children than female children.
Finally, the pyramid for the United States shows the baby boom that followed World War II. The population pyramids tell us far more about a country than just a set of numbers by showing both where it's been and where it's headed within a single image. And in today's increasingly interconnected world, facing issues such as food shortages, ecological threats, and economic disparities, it is increasingly important for both scientists and policymakers to have a rich and complex understanding of populations and the factors affecting them.
Source: TED Ed. Written by Kim Preshoff.
Answers
Scroll down for the answers.

Answers:
1 B China
2 E Russia
3 C Rwanda
4 A Japan
To learn How to Answer Name Matching Questions, click this link.
More IELTS Reading Practice Samples
Here are a few examples of the many practice activites I've created:
Sample 1 – What matters most when speaking a new language
Sample 2 – Fire evacuation plan (GT)
Sample 3 – Climate change and loss of biodiversity
Sample 4 – The wasp queen
Sample 5 – Discovering our ancestors
Sample 6 – Telecommunication - undersea cables
Sample 7 – Biodiversity
Sample 8 – Mining asteroids
Sample 9 – Dress Code Policy (GT)
Sample 10 – How to fight desertification & drought
To see the full list of practice samples, click this link:
›


Testimonials
“I am very excited to have found such fabulous and detailed content. I commend your good work.” Jose M.
“Thanks for the amazing videos.
These are ‘to the point’, short videos, beautifully explained with practical
examples." Adari J.
"Hi Jacky, I bought a listening book from you this morning. You know what? I’m 100% satisfied. It’s super helpful. If I’d had the chance to read this book 7 years ago, my job would be very different now." Loi H.
"Hi Jacky, I recently
got my IELTS results and I was pleased to discover that I got an 8.5 score. I'm
firmly convinced your website and your videos played a strategic role in my
preparation. I was able to improve my writing skills thanks to the effective
method you provide. I also only relied on your tips regarding the reading
section and I was able to get a 9! Thank you very much." Giano
“After listening to your videos, I knew I had to ditch
every other IELTS tutor I'd been listening to. Your explanations are clear and
easy to understand. Anyways, I took the test a few weeks ago and my result came
back: Speaking 7, listening 9, Reading 8.5 and Writing 7 with an average band
score of 8. Thanks, IELTS Jacky." Laide Z.